
Table 3.
Comparison of SHORE and MAQ for SNP prediction with all Bur-0 reads
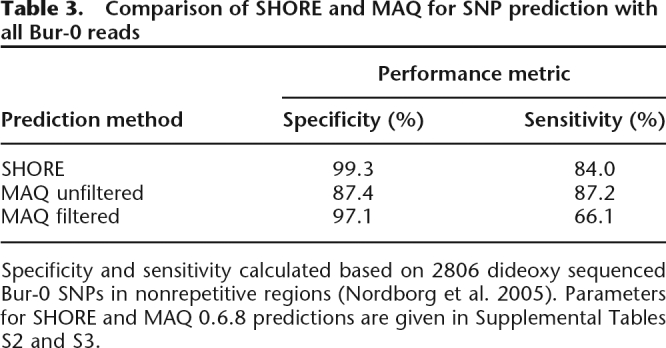
Specificity and sensitivity calculated based on 2806 dideoxy sequenced Bur-0 SNPs in nonrepetitive regions (Nordborg et al. 2005). Parameters for SHORE and MAQ 0.6.8 predictions are given in Supplemental Tables S2 and S3.