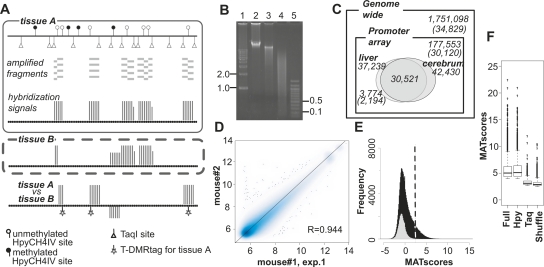
Figure 1.
DNA methylation profiles were analyzed by D-REAM. (A) Illustration of the D-REAM method. Genomic DNA was digested with methylation-sensitive restriction enzyme HpyCH4IV and amplified by modified LM-PCR (Supplemental Fig. S1). Amplified fragments (gray bars) were hybridized with mouse promoter tiling array (upper panel). Array signal intensities (vertical bars) were analyzed to identify regions corresponding to fragments in unmethylated HpyCH4IV loci. Comparison of signals from different samples enabled identification of differentially methylated regions (lower panel). HpyCH4IV loci overlapping with regions yielding differential signals were defined as T-DMRtags. (B) Agarose gel electrophoresis of undigested (lane 2), HpyCH4IV-digested (lane 3), and HpyCH4IV–TaqI-digested (lane 4) mouse liver DNA. Positions corresponding to 0.1, 0.5, 1.0, and 2.0 kbp (lanes 1,5) are indicated on one side of the gel image. (C) Venn diagram of DNA methylation status at HpyCH4IV sites in mouse liver and cerebrum. Numbers without parentheses represent numbers of HpyCH4IV sites, while Ensembl transcripts IDs are in parentheses. Outer and inner rectangles represent whole mouse genome and regions covered by the promoter tiling array, respectively. Ovals indicate unmethylated HpyCH4IV sites of liver and cerebrum identified by D-REAM. (D) Correlation of microarray probe intensities in duplicate mouse liver experiments, plotted on logarithmic axes (base 2). (E) MATscore distribution of array regions corresponding to the TaqI–TaqI fragments (gray) and HpyCH4IV-digested fragments (black). The dotted line represents the MATscore cutoff value. (F) Reliability of comparative MAT analysis. Bar-plots of MATscores of the hypomethylated regions identified by MAT (P < 10−3) using full .bpmap (Full) and subsets of .bpmap corresponding to HpyCH4IV fragments (Hpy) and TaqI–TaqI fragments (Taq). Shuffle column MATscores obtained by using both treatment and control samples containing both liver and cerebrum data from different mice. The boxes, and lines within the boxes, represent the interquartile ranges and medians of the ratios, respectively.

