Figure 2.
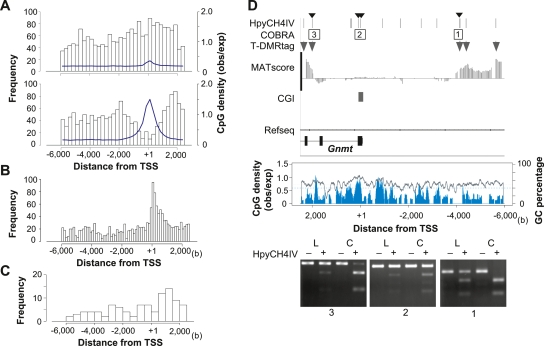
T-DMR positions depend on the genomic context. (A) Distribution of positions relative to TSS of hypomethylated T-DMRtags in liver. Upper and lower panels display distributions in non-CGI and CGI genes, respectively. The width of histogram units is 250 bp. CpG densities are indicated by blue lines. (B) Center of phastCons track regions in all CGI genes on chromosomes 5, 12, and 15 (obtained from UCSC genome browser database) plotted with a histogram unit width of 125 bp. (C) Positions of T-DMRtags on liver-specific non-CGI genes with HNF1 motifs with expression levels in liver >2-fold those in cerebrum, plotted with a 500-bp histogram category width. (D) T-DMRs neighboring the Gnmt genes analyzed by COBRA. Upper panel displays the position of HpyCH4IV, the regions of restriction mapping with the analyzed HpyCH4IV site, indicated by small arrowheads on the top, and positions of T-DMRs plotted over the comparative MATscores on IGB browser from 6000 bp upstream to 2500 bp downstream from the TSS. Middle panel shows CpG density (blue) and GC percentage (gray line) in this region. Bottom panels show agarose-gel electrophoresis images of COBRA. Hypomethylated fragments converted by bisulfite treatment were resistant to HpyCH4IV digestion (+). L and C indicate liver and cerebrum samples, respectively.

