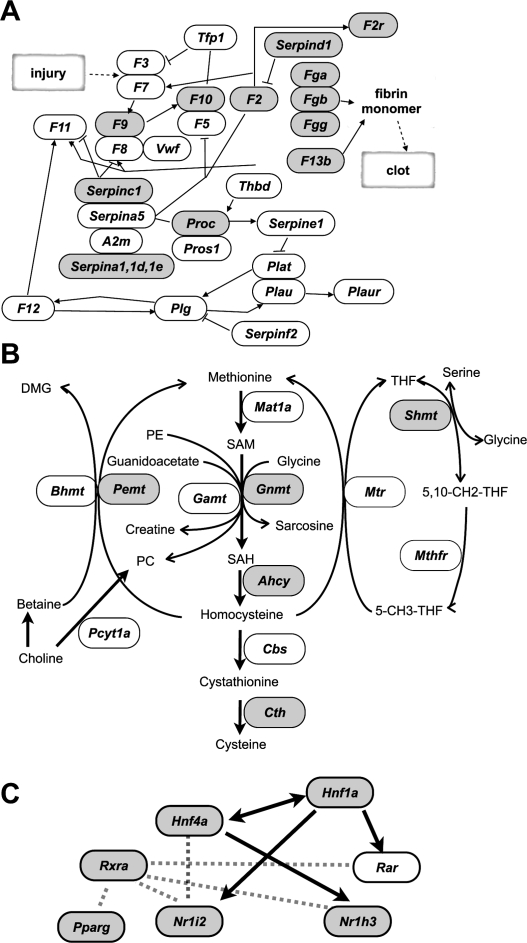
Figure 3.
Genes with T-DMRtags (gray) in the complement and coagulation cascade in the modified KEGG pathway map (ID 04610) (A), and in the folate and methyl group metabolism pathway (Williams and Schalinske 2007) (B). (C) Transcription factor network for liver-specific gene expression. Arrows indicate that the gene expression is controlled by transcription factors. Dotted lines represent molecular interaction between factors.

