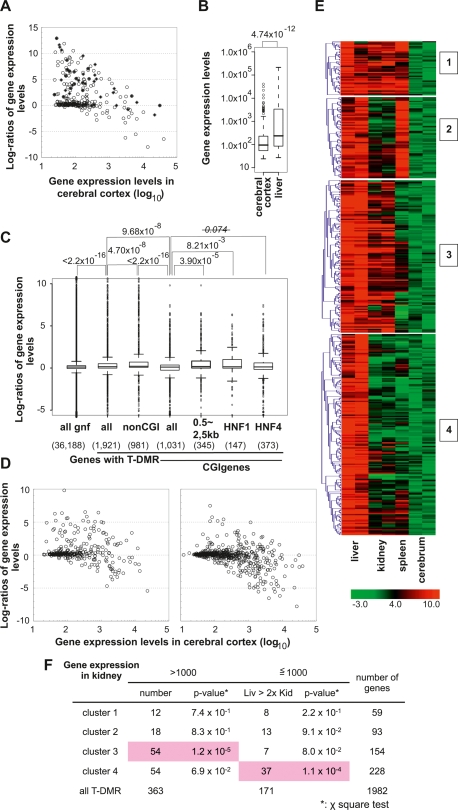
Figure 5.
The tissue-specific DNA methylation profiles and gene expression in mouse tissues. (A) Expression levels of human gene orthologs identified by the ChIP-Chip experiment using anti-HNF1 (closed rectangles) and of genes with HNF-1A motifs (model IDs T01211 and T00368) classified by the MAPPER database (open circles). (B) The distribution of expression levels of the genes listed in A, in cerebrum and liver represented by box plots. Expression levels were box-plotted with logarithmic scale (base = 10). (C) Box plots of log ratios (base = 2) of liver and cerebrum gene expression indicate factors affecting liver-specific expression of genes with T-DMRs. P-values obtained from Wilcoxon’s matched-pair signed rank test are indicated on the top of the plot. (D) Correlation of expression between two tissues. CGI genes containing T-DMRs are divided into two groups by the position of T-DMRs: T-DMRs within 0.5 to 2.5 kb downstream from the TSS (left panel) and those outside of this region (right panel). Gene expression levels and ratios of gene expression levels are expressed with logarithmic scale of base 10 and base 2, respectively. Numbers of liver-specific genes expressed, with expression levels <1000 in cerebral cortex and at a liver:cerebral cortex level ratio of >2, in the left and right panels are 60 out of 346 and 45 out of 685, respectively. (E) K-means clustering of regions corresponding to T-DMRs by Pearson’s correlations of their MATscores. The ranges of the MATscores represented in the plot are shown at the bottom of the panels. The MATscores were obtained by MAT analysis of D-REAM data from liver, kidney, and spleen using cerebrum data as the control. (F) χ2 test for distributions of genes, classified by the expression levels, first in kidney (>1000 or not) and those in the later set divided by their expression in liver (>2-fold of those in kidney or not), in each cluster. Statistically significant distributions are shadowed in pink.

