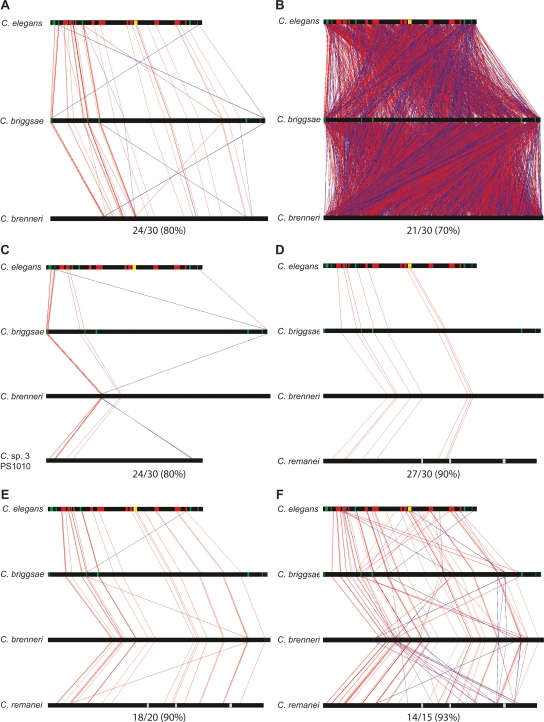
Figure 2.
MUSSA comparisons highlighted ungapped sequence matches. Horizontal black bars represent the nematode sequences. The top sequence, C. elegans, has green sections for exons (with lin-39 on the left and ceh-13 on the right), red sections for each of the N regions, and a yellow section for region N8, which encompasses mir-231 and its promoter. The vertical lines highlight ungapped sequence MUSSA matches, with red lines for matches facing the same direction and blue lines for reverse-complement matches. The MUSSA matches represent transitive alignments, meaning they match across all sequences compared. (A) At high thresholds the vertical red lines are largely parallel, reflecting predominant colinearity of conserved sequence identified with 80% (24/30) sequence identity for a 30-bp window. As the threshold (identity/window length) decreases, more matches are identified by MUSSA but the noise also increases. (B) At a lower threshold, 70% (21/30), the graph is packed with many lines that cross each other, producing a cluttered, cross-hatched pattern. The number of species being compared may also be varied, giving a range of matches. Comparisons, using a 30-bp window, are shown between C. elegans, C. briggsae, and C. brenneri at 80% (24/30) (A) and C. elegans, C. briggsae, C. brenneri, and C. sp. 3 PS1010 at 80% (24/30) (C). The window size can also be varied at a constant threshold, as between 27/30 (90%) (D), 18/20 (90%) (E), and 14/15 (93%) (F).

