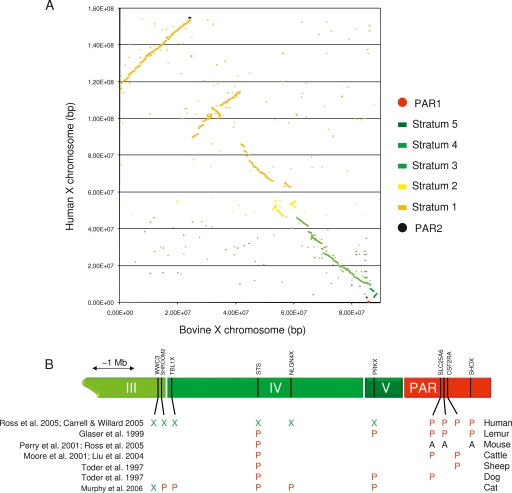
Figure 1.
(A) Graphical representation of unique BLAST hits (E-value < 10−2) between the human and bovine X chromosomes. Sequences mapping to human PAR1-2 or strata 1–5 are color-labeled as indicated. (B) Schematic representation of distal Xp in human indicating the limits between strata III, IV, and V (green) and PAR1 (red), and approximate positions of 10 genes. Known pseudoautosomal (P), X-specific (X), or autosomal (A) status of orthologs in six mammals with corresponding references.

