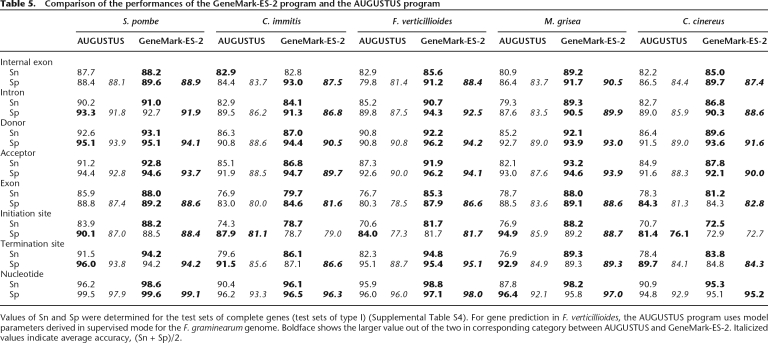
Table 5.
Comparison of the performances of the GeneMark-ES-2 program and the AUGUSTUS program
Values of Sn and Sp were determined for the test sets of complete genes (test sets of type I) (Supplemental Table S4). For gene prediction in F. verticillioides, the AUGUSTUS program uses model parameters derived in supervised mode for the F. graminearum genome. Boldface shows the larger value out of the two in corresponding category between AUGUSTUS and GeneMark-ES-2. Italicized values indicate average accuracy, (Sn + Sp)/2.

