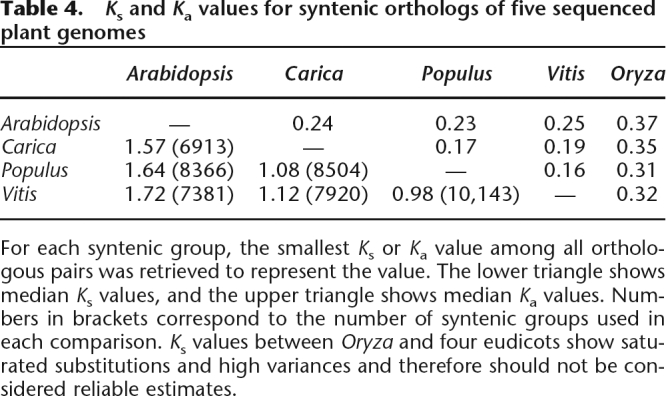
Table 4.
Ks and Ka values for syntenic orthologs of five sequenced plant genomes

For each syntenic group, the smallest Ks or Ka value among all orthologous pairs was retrieved to represent the value. The lower triangle shows median Ks values, and the upper triangle shows median Ka values. Numbers in brackets correspond to the number of syntenic groups used in each comparison. Ks values between Oryza and four eudicots show saturated substitutions and high variances and therefore should not be considered reliable estimates.
