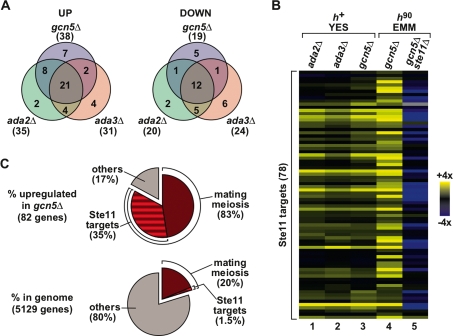
Figure 2.
Transcriptome analysis of SAGA HAT mutants. (A) Venn diagrams show the high degree of overlap of genes with increased (“UP,” left panel) or reduced (“DOWN,” right panel) mRNA levels in heterothallic h+ gcn5Δ, ada2Δ and ada3Δ deletion mutants, grown in complete rich media (YES). The total number of genes affected more than twofold for each data set is indicated in parentheses. (B) Hierarchical clustering of the 78 Ste11 target genes, as defined previously (Mata and Bähler 2006), shows the increased level of mRNAs for the Ste11-dependent targets in gcn5Δ, ada2Δ, and ada3Δ deletion mutants. The dendrogram shows Ste11 target genes in rows with their expression changes in h+ gcn5Δ, ada2Δ, and ada3Δ mutants grown in YES (columns 1–3) or in h90 gcn5Δ and gcn5Δ ste11Δ mutants grown in minimal rich medium (EMM) (columns 4,5). The data are presented as a mutant/wild-type ratio of hybridization signals and are color-coded as indicated in the key. (C) Pie charts showing the enrichment of functional categories related to mating and meiosis in the set of genes with increased mRNA levels in homothallic h90 gcn5Δ mutants grown in EMM (top chart), compared with their representation in the genome (bottom chart). The percentage value of a category in the genome corresponds to the percentage observed if that category was found randomly in the data set. The category “mating/meiosis” (dark red, 958 genes) includes all genes whose expression is up-regulated during pat1-114-driven meiosis (as defined in Mata et al. 2002), including the set of “Ste11 targets” (dark- and light-red stripes, 78 genes, defined in A). The category “others” contains all genes not present in either of the two categories mentioned above.

