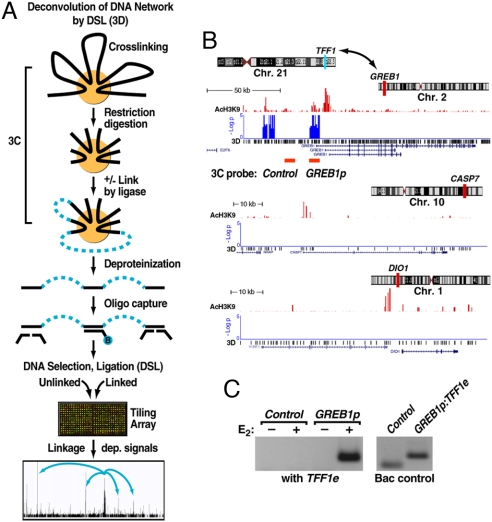
Fig. 1.
Identification of long-range, estrogen induced chromosomal interactions by 3D. (A) Diagram of the 3D technology. The initial steps are identical to the established 3C technology. A key extension is DNA capturing by using a specific biotinylated oligonucleotide followed by DNA selection and ligation to detect cocaptured DNA fragments in a high-throughput and unbiased fashion. Specific signals were identified based on relative enrichment of DNA fragments linked by ligase compared with those from the parallel minus ligase control under an extensive dilution condition. (B) Specific interchromosomal interactions predicted by 3D. Three of the 6 assessed chromosomal intervals are shown, plotting the location of AcH3K9, an activation mark (red), and signal enrichment in 3D assay (blue) at the GREB1 locus (chromosome 2). Two negative controls (CASP7 in chromosome 10 and DIO1 in chromosome 1) show significant levels of AcH3K9 but no 3D signal. (C) 3C validation of the detected interchromosomal interaction predicted by 3D between TFF1 enhancer (chromosome 21) and GREB1 promoters (chromosome 2) in mock-treated and E2-induced (60 min) HMECs in which only the sample treated with E2 shows a strong interaction. (Right) Shows the primer efficiency obtained on randomly ligated BAC controls. The location of the 3C primers for GREB1 is indicted below the 3D signal track in B.

