Fig. 2.
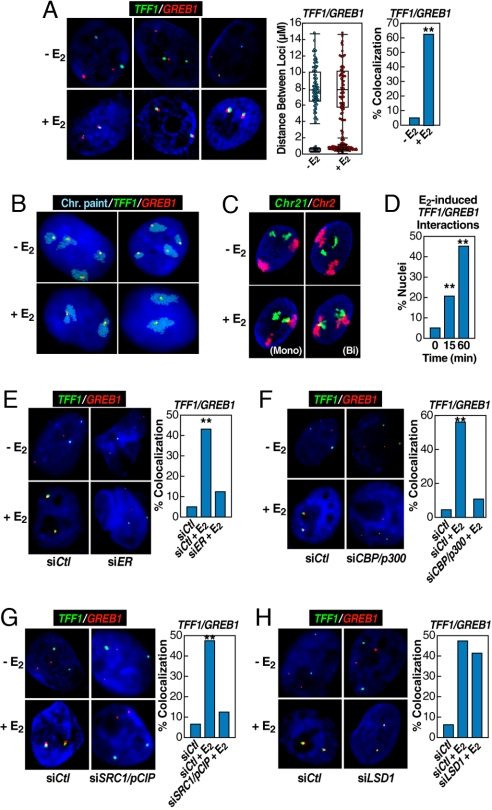
Rapid induction of interchromosomal interactions by nuclear hormone signaling. (A) 3D-FISH confirmation of E2-induced (60 min) TFF1:GREB1 interchromosomal interactions in HMECs with the distribution of loci distances measured (box plot with scatter plot) and quantification of colocalization (bar graph) before and after E2 treatment. Cells exhibiting mono- or biallelic interactions were combined for comparison with cells showing no colocalization; statistical significance in the bar graph was determined by χ2 test (**, P < 0.001). (B) 2D FISH confirmation of the interchromosomal interactions in MCF7 cells by combining chromosome paint (aqua) and specific DNA probes (green and red). (Upper) Illustrates two examples of mock-treated cells. (Lower) Shows the biallelic interactions/nuclear reorganization after E2 treatment for 60 min, exhibiting kissing events between chromosome 21 and chromosome 2. (C) Similar analysis on HMECs, but in this case using 3D FISH to paint chromosome 2 (red) and chromosome 21 (green), showing E2-induced chromosome 2–chromosome 21 interaction. Both assays revealed neither chromosome 21–chromosome 21 nor chromosome 2–chromosome 2 interactions in response to E2. (D) Temporal kinetics of GREB1:TFF1 interactions by 3D FISH in HMECs (**, P < 0.001 by χ2). (E–G) Nuclear microinjection of siRNA against ERα, CBP/p300, or SRC1/pCIP prevented E2-induced interchromosomal interactions, counting both mono- and biallelic interactions (**, P < 0.001 by χ2). The injection of siER and siDLC1 were done in the same experiment, sharing the same control group. (H) Nuclear microinjection of siRNA against LSD1, which was shown to be required for estrogen-induced gene expression (22), did not block E2-induced interchromosomal interactions. The injection of siLSD1 and SRC1/pCIP were done in a single experiment, sharing the same control group.

