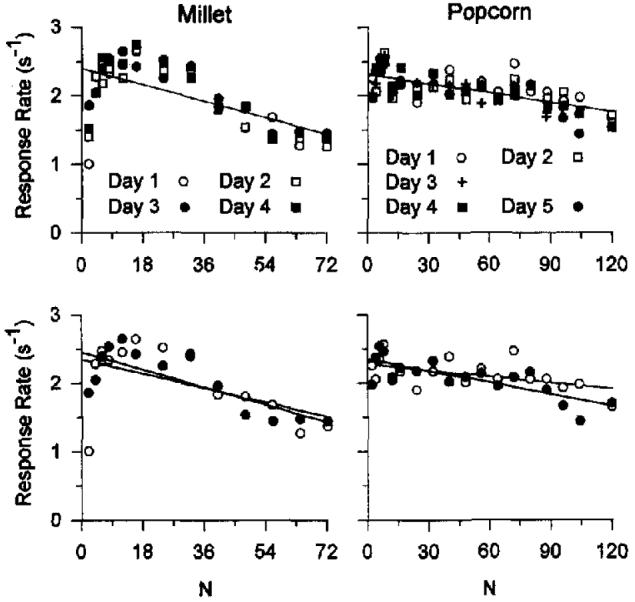
Figure 3.

Right column: Response rates for Sessions 1–4 from Experiment 1, averaged across pigeons and displayed as a function of fixed-ratio (FR) values (top panel), with the data from Sessions 1–4 compared directly (bottom panel). Left column: Response rates for the Sessions 1–5 from Experiment 2, averaged across pigeons and displayed as a function of FR values (top panel), with the data from Sessions 1–4 redisplayed in the bottom panel. The 95% confidence intervals for the regressions within each panel overlap.
