Fig. 6.
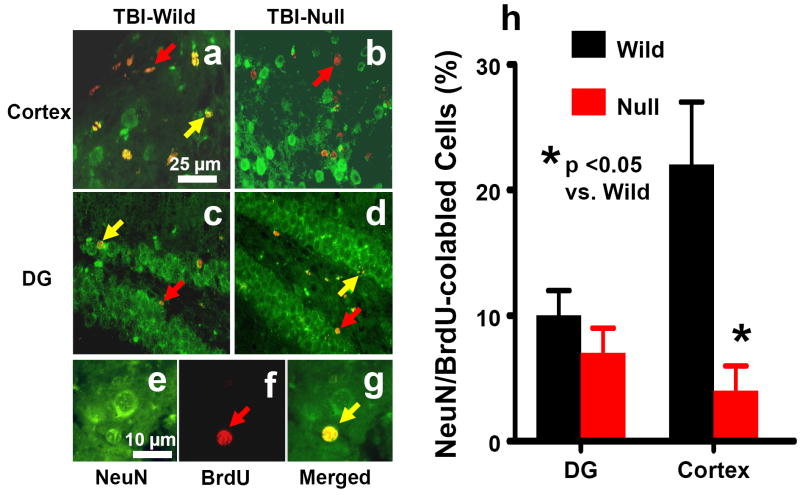
Double fluorescent staining for BrdU (red) and NeuN (green) to identify neurogenesis (yellow after merge) in the cortex (a and b, arrow as example) and the dentate gyrus (c and d, arrow as example) of the ipsilateral, injured hemisphere at 35 days after TBI. Newborn BrdU-positive cells (red, f) differentiate into neurons expressing NeuN (yellow, g). Scale bars: 25μm (a-d); 10μm (e-g). The percentage of NeuN/BrdU-colabeled cells is shown in (h). Data represent mean with SD. N (mice/group) = 6 (Sham-Wild); 8 (TBI-Wild); 6 (Sham-Null); 10 (TBI-Null).

