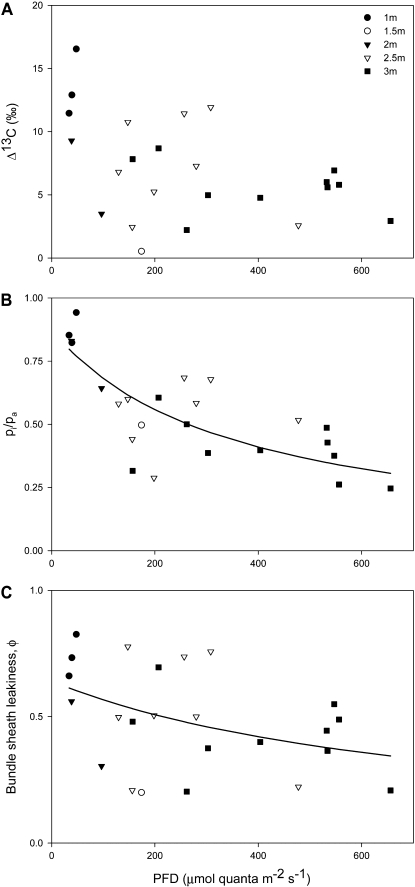
Figure 4.
A, Short-term Δ13C measured concurrently with gas exchange at natural light intensity for leaves at 1-m (n = 3), 1.5-m (n = 1), 2-m (n = 2), 2.5-m (n = 8), and 3-m (n = 9) height. B, Ratio between internal and ambient CO2 mole fractions. The line plot represents nonlinear regression [pi/pa = (a × b)/(b + PFD), where a = 0.8738, b = 353.2301, r2 = 0.55] used in Figure 6 to calculate canopy φ. C, φ calculated with Equation 1 using measurements of Δ13C (A) and the ratio between internal and ambient CO2 mole fractions (B). The line plot shows the best fit of φ [(a × b)/(b + PFD), where a = 0.6409, b = 763.0974, r2 = 0.16] used in Figure 6 to calculate An.

