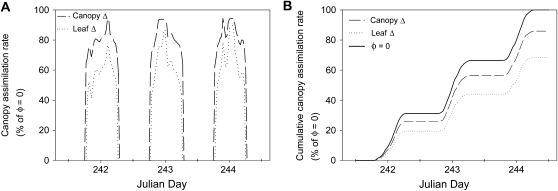
Figure 6.
Results for August 29 to August 31, 2007 (Julian days 242–244). A, Modeled canopy An for two scenarios: φ based on leaf level measurements of Δ13C and on canopy Δ13C (rates are depicted as percentages of φ = 0). φ is taken from regression φ = a × b/(b + PFD), where a = 0.6409 and b = 763.0974 for leaf level (Figure 4C) and a = 0.4014 and b = 470.342 for canopy level (based on nonlinear fit of the canopy model in Figure 5C, using Eq. 3). B, Cumulative modeled canopy An for φ = 0, based on leaf level measurements of Δ13C and on canopy Δ13C. Scenarios are compared with total cumulative canopy An with φ = 0.

