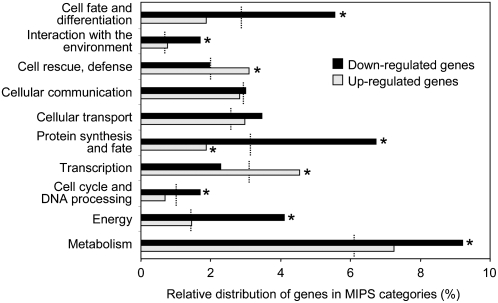
Figure 3.
Functional categorization of MTX-regulated genes. Highly responsive genes were separated into up-regulated (gray bars) and down-regulated (black bars) sets and classified into functional categories using the MIPS interface (Ruepp et al., 2004). The proportion (in percent) of MTX-responsive genes identified in each category is indicated on the x axis. Dotted lines indicate the distribution (percent) of all the Arabidopsis genes in each MIPS category. Asterisks indicate that the distribution of MTX-responsive genes is significantly different from that of Arabidopsis genes using a chi-square test with an α risk of P < 0.01. Genes of unknown function, which represent 74% of the Arabidopsis genes and 66% of the MTX-responsive genes, were excluded from the figure for clarity.

