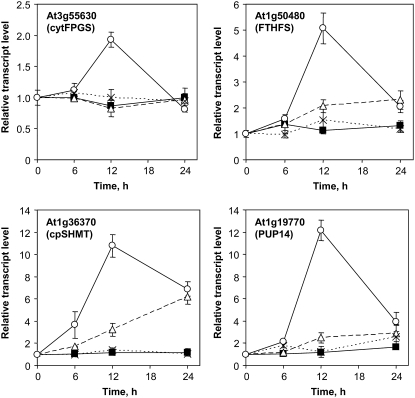
Figure 5.
Expression profiles of genes involved in the adaptation of C1 metabolism in response to folate depletion. The relative steady-state transcript levels for At3g55630 (cytFPGS), At1g50480 (FTHFS), At1g36370 (cpSHMT), and At1g19770 (PUP14) were determined by qPCR. Control cells (▪) and cells treated with MTX (○), MTX and LV (△), and LV (×) were analyzed after 0, 6, 12, and 24 h of treatment. The actin2/7 gene (At5g09810) was used to normalize qPCR data. Data are means of three biological replicates and sd.

