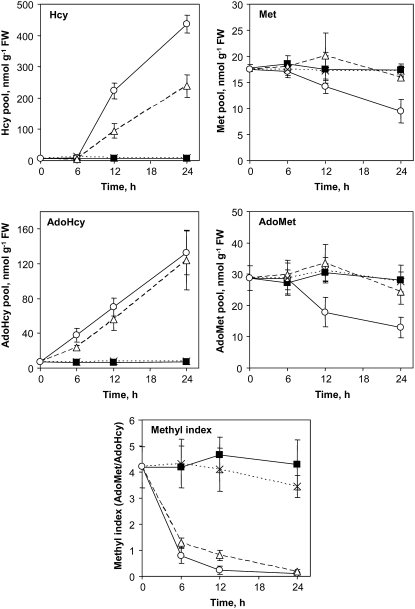
Figure 6.
Analysis of key intermediates of the activated methyl cycle in Arabidopsis cells treated with MTX and LV. Control cells (▪) and cells treated with MTX (○), MTX and LV (△), and LV (×) were analyzed after 0, 6, 12, and 24 h of treatment. The pools of Met, Hcy, AdoMet, and AdoHcy were determined by RP-HPLC after derivatization with specific probes as described in “Materials and Methods.” The methyl index was determined as the AdoMet to AdoHcy ratio. Data are means of three biological replicates and sd.

