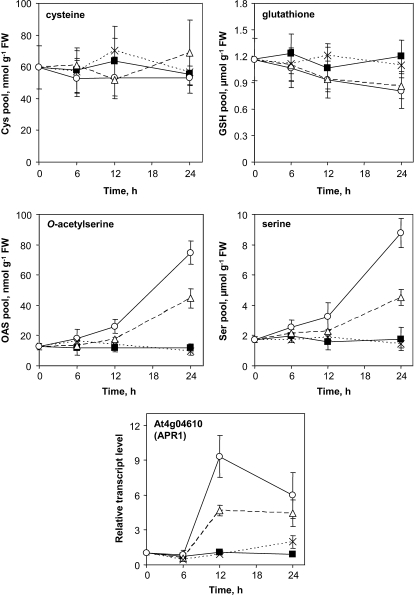
Figure 7.
Measurements of key metabolites and gene of S metabolism in folate-depleted cells. Control cells (▪) and cells treated with MTX (○), MTX and LV (△), and LV (×) were analyzed after 0, 6, 12, and 24 h of treatment. The pools of Cys and glutathione, on the one hand, and of OAS and Ser, on the other hand, were determined by RP-HPLC after derivatization with monobromobimane and O-phthaldialdehyde, respectively. The relative steady-state transcript level for At4g04610 (APR1) was determined by qPCR. The actin2/7 gene (At5g09810) was used to normalize qPCR data. Data are means of three biological replicates and sd.

