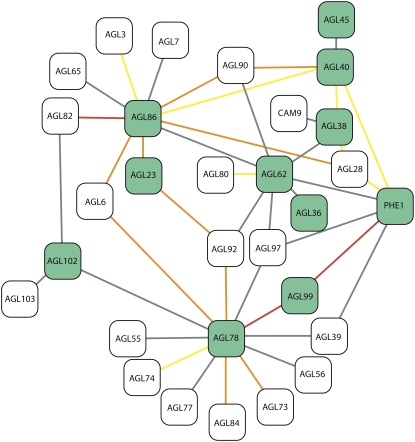
Figure 2.
Interaction summary of endosperm-preferred MADS box transcription factors. Interaction plot of endosperm-preferred MADS box transcription factors in the array data adapted from the output of the Arabidopsis Interactions Viewer at http://bar.utoronto.ca/. Black outline corresponds to genes differentially expressed in our array data. Dark and pale green fill corresponds to >2.0-fold endosperm-enriched and 1.5- to 2-fold endosperm-enriched transcripts, respectively. Gray outline represents genes not differentially expressed in the array data. Connecting lines indicate that a protein-protein interaction is evident in the literature. The more red the line, the better the correlation for transcript expression across the AtGenExpress expression series, as assessed by Pearson correlation. [See online article for color version of this figure.]

