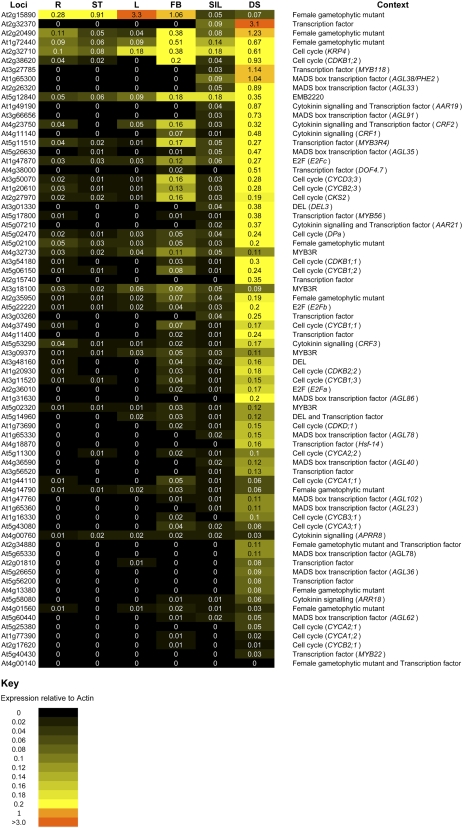
Figure 3.
Heat map showing qRT-PCR validation of early seed and/or early seed-specific expression. The expression level of each transcript was calculated relative to ACTIN2. R, ST, L, FB, SIL, and DS represents roots, stems, leaves, flower buds, siliques, and dissected seeds, respectively. Context relates to the section of the article in which a particular gene is discussed. [See online article for color version of this figure.]

