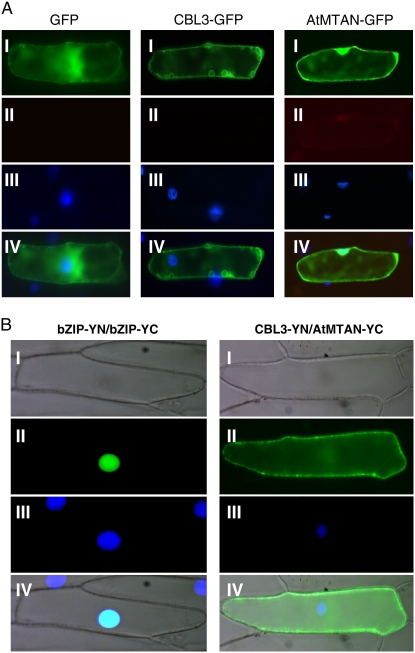
Figure 7.
Subcellular localization of the CBL3 and AtMTAN proteins and their association in a plant cell. A, Fluorescence images. The indicated plasmids were introduced into the onion epidermal cells via the biolistic particle-delivery system. Following a 4-h incubation at 23°C, the onion cells were analyzed with a fluorescence microscope. I and II show images of GFP and autofluorescence, respectively. III shows nuclei visualized by 4′,6-diamidino-2-phenylindole (DAPI) staining. IV shows the merged image. B, BiFC assay. The CBL3-YN and AtMTAN-YC constructs were coexpressed in onion epidermal cells. The bZIP63-YN and bZIP63-YC plasmids were used as a positive control. I and II show images of bright field and YFP, respectively. III shows the DAPI-stained nuclei. The merged images are shown in IV.

