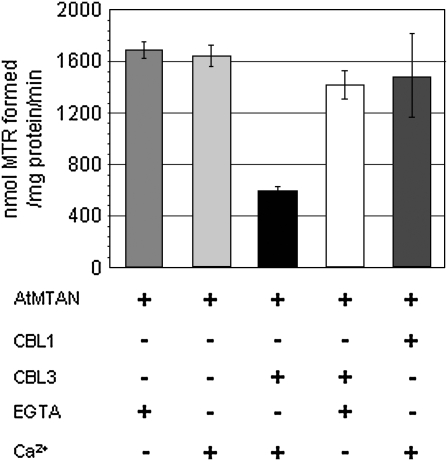
Figure 8.
MTAN activity of AtMTAN is inhibited by Ca2+-bound CBL3. The MTAN activity is represented with the amount of MTR generated from the hydrolysis of MTA by the action of 1 mg of AtMTAN for 1 min at 37°C. + and − indicate the presence and absence, respectively, of the indicated components in the reaction samples. Each value represents the average of three independent experiments. Error bars indicate se values.

