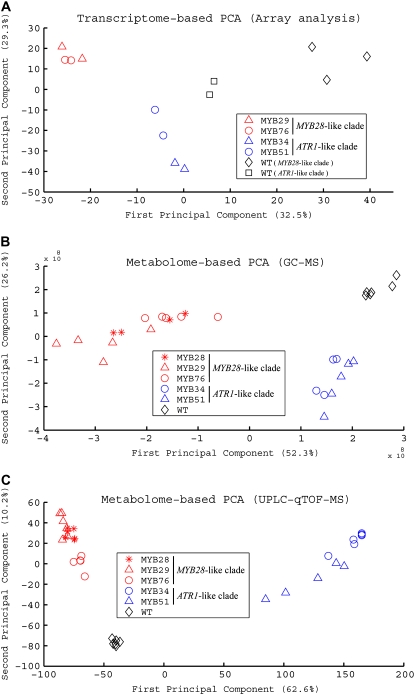
Figure 4.
Metabolite and expression profiles of plants overexpressing members of the two GS regulators differ between them and from those of wild-type plants. PCA of data sets obtained using three different technologies: mRNA GeneChip array (A), GC-MS (B), and UPLC-qTOF-MS (C). In all sections, red symbols mark plants overexpressing the MYB28-like clade genes, blue symbols mark plants overexpressing the ATR1-like clade genes, and black symbols mark wild-type (WT) plants.

