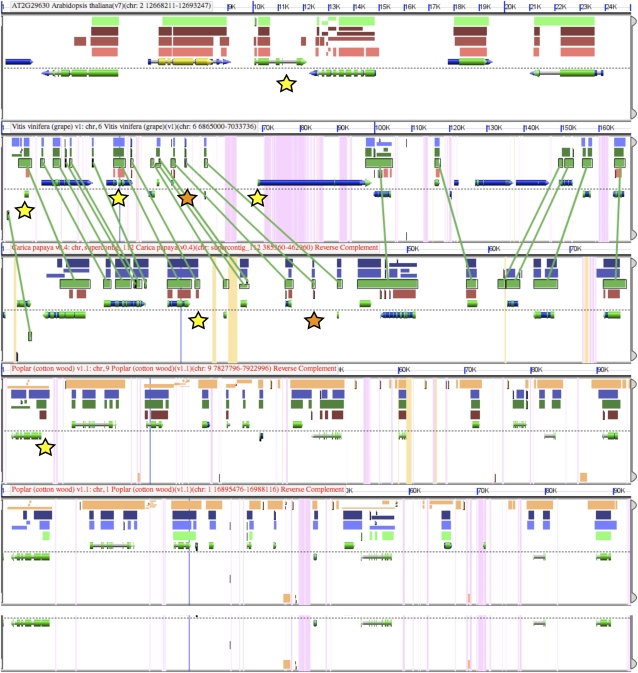
Figure 2.
A screenshot of the BLASTz output from a syntenic comparison among chromosomal regions of Arabidopsis, papaya, and grape and two regions of poplar derived from its most recent genome duplication event. Each horizontal image is a visualization of one genomic region. The dashed line in the middle of each region represents the division between the top (5′ on left) and the bottom (5′ on right) strand. Gene models are drawn as colored arrows directly above or below this line, with CDS colored green, RNA blue, and the full gene model as gray to show introns. BLASTz was used to find regions of similarity (i.e. BLAST hits) between all pairwise sequence comparisons and are drawn as colored blocks above or below gene models, with each color representing one pairwise comparison. BLAST hits in the (++) and (+−) orientation are drawn above and below the dashed line, respectively. Green lines are drawn connecting BLAST hits between grape and papaya (second and third genomic regions, respectively). Such collinearity of BLAST hits is evidence for synteny, which is a pattern repeated between all pairwise comparisons of these genomic regions. Gold and orange stars highlight possible annotation errors and missing annotations, respectively, based on discordance of gene models and regions of sequence similarity. Results can be regenerated using http://tinyurl.com/4n3npz and research might be resumed.

