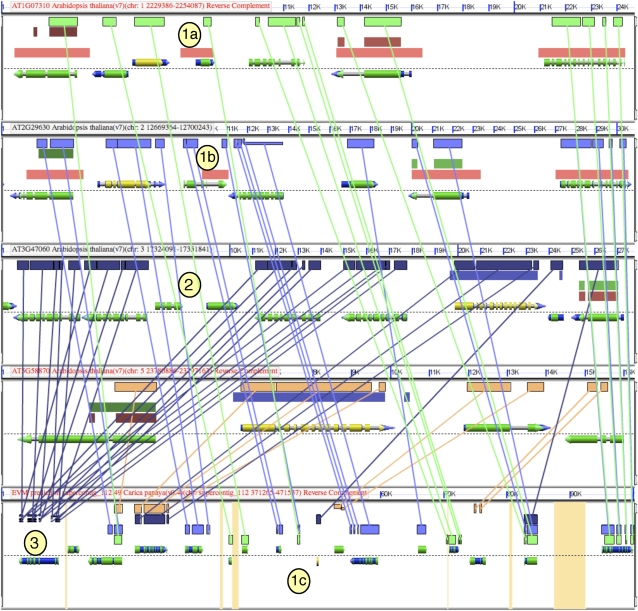
Figure 3.
A screenshot of the BLASTz output for a syntenic comparison among four Arabidopsis regions and one papaya region (top to bottom). Figure attributes are as described in the Figure 2 legend. Orange in the background of the papaya genomic region indicates unsequenced regions. Lines connecting regions of sequence similarity have been drawn between each Arabidopsis region and papaya. Circled numbers refer to (1) possible annotation error evidenced by sequence similarity between two regions of Arabidopsis (1a, 1b) and papaya (1c); (2) insertion into a tandem array of locally duplicated genes; and (3) evidence for local duplication in Arabidopsis lineage due to multiple genes mapping to the same region in papaya. This research can be revisited at http://tinyurl.com/2vzcsk.

