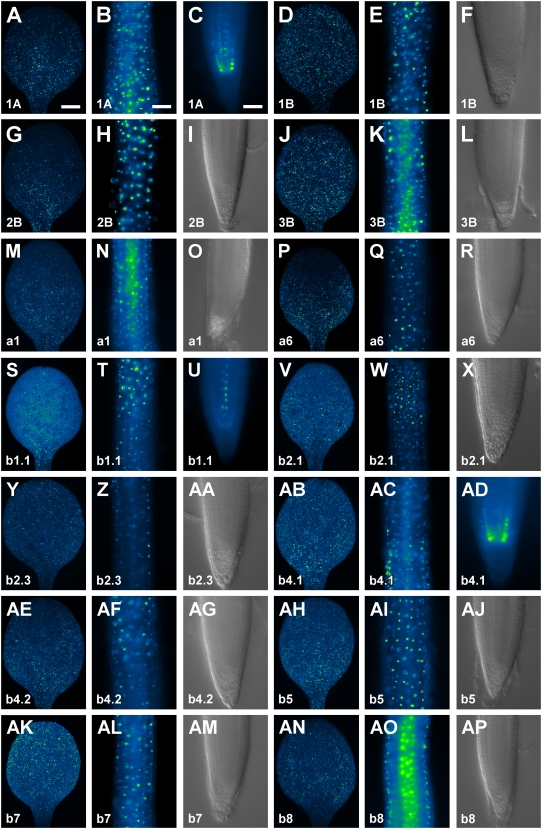
Figure 2.
RbcS and Lhc expression in seedling organs. In-figure information, color code, and abbreviations are as described in Figure 1. Equivalent organs are displayed at identical magnification; therefore, for simplicity, scale bars are only reported in the first image of the respective organ series. A to E, G, H, J, K, M, N, P, Q, S to W, Y, Z, AB to AF, AH, AI, AK, AL, AN, and AO, Wide-field epifluorescence microscopy. F, I, L, O, R, X, AA, AG, AJ, AM, and AP, Differential interference contrast microscopy. A, D, G, J, M, P, S, V, Y, AB, AE, AH, AK, and AN, Cotyledons, adaxial view. B, E, H, K, N, Q, T, W, Z, AC, AF, AI, AL, and AO, Hypocotyls. C, F, I, L, O, R, U, X, AA, AD, AG, AJ, AM, and AP, Root tips. Bars: A, 150 μm; B, 150 μm; C, 50 μm.

