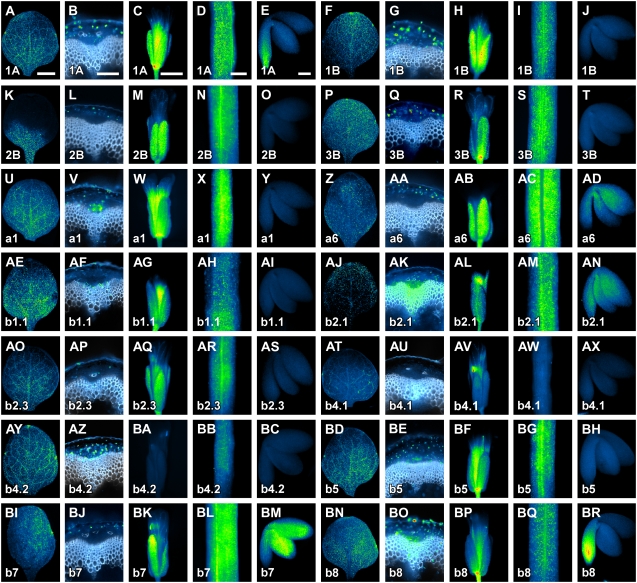
Figure 3.
RbcS and Lhc expression in mature plant organs and embryos. In-figure information, color code, and abbreviations are as described in Figure 1. Equivalent organs are displayed at identical magnification; therefore, for simplicity, scale bars are only reported in the first image of the respective organ series. Wide-field epifluorescence microscopy throughout. A, F, K, P, U, Z, AE, AJ, AO, AT, AY, BD, BI, and BN, First leaves 14 DAG, abaxial view. B, G, L, Q, V, Z, AA, AF, AK, AP, AU, AZ, BE, BJ, and BO, Cross sections through the lowermost region of the stem of plants at stage 2 (Altamura et al., 2001); white, lignin autofluorescence. C, H, M, R, W, AB, AG, AL, AQ, AV, BA, BF, BK, and BP, Flowers at stages 13 to 15 (Smyth et al., 1990). D, I, N, S, X, AC, AH, AM, AR, AW, BB, BG, BL, and BQ, Mature siliques of plants at stage 2. E, J, O, T, Y, AD, AI, AN, AS, AX, BC, BH, BM, and BR, Mature embryos of plants at stage 2. Bars: A and D, 1 mm; B and E, 100 μm; C, 250 μm.

