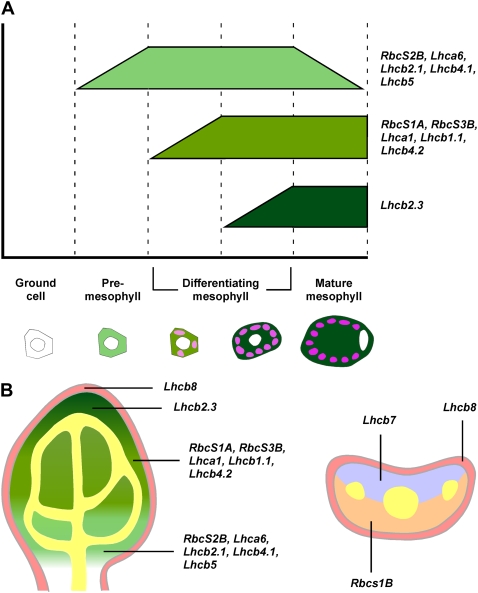
Figure 8.
Schematic summary of RbcS and Lhc expression in leaf development. A, Graphic representation of temporal expression profiles and associated stages of leaf mesophyll cell development. Green bars indicate the duration of maximum expression of each cohort of genes; ramped termini denote gradual initiation or decline of gene expression. B, Tissue map of a paradermal (left) or a transverse (right) median section through a developing leaf illustrating fields of gene expression. Different shades of green indicate consecutive onset of gene expression and corresponding stages of mesophyll ontogeny as defined in A. Orange, abaxial side; pink, epidermis; purple, adaxial side; yellow, preprocambial and procambial cells as visualized through Athb8 expression (Baima et al., 1995; Kang and Dengler, 2004; Scarpella et al., 2004).

