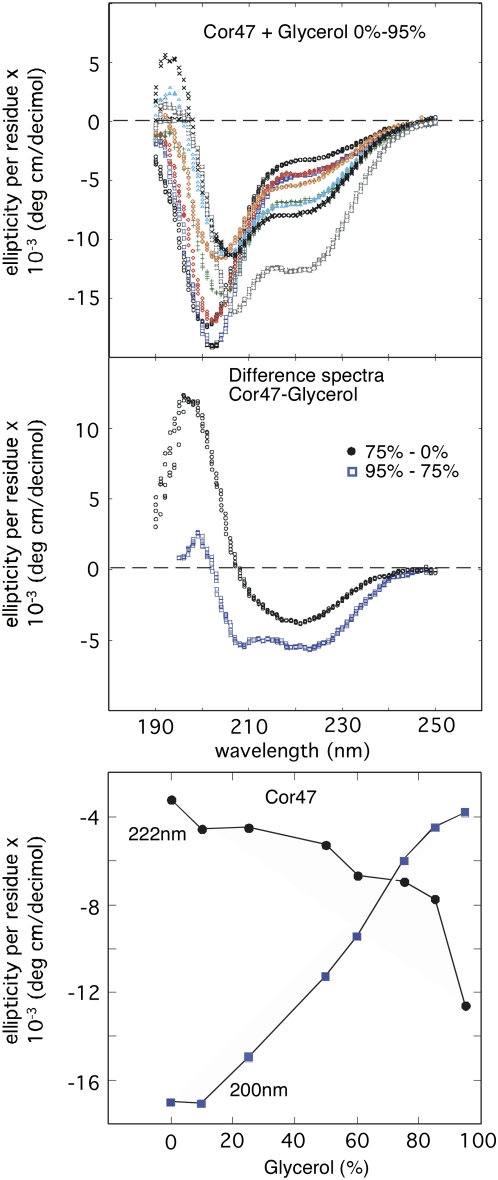
Figure 5.
Top, CD spectra of the glycerol titration of Cor47. The spectra show from top at 220 nm, 0%, 10%, 25%, 50%, 60%, 75%, and 95% glycerol. Middle, CD difference spectra showing that the structural induction of Cor47 with glycerol occurs in two steps. Between 0% and 75%, glycerol Cor47 displays a mix of β-sheet and α-helices, while above 75%, it displays mainly α-helices. Bottom, Changes in the CD signal at 200 and 222 nm upon titration of Cor47 with glycerol, illustrating the transitions to mixed and pure α-helical structures, respectively.

