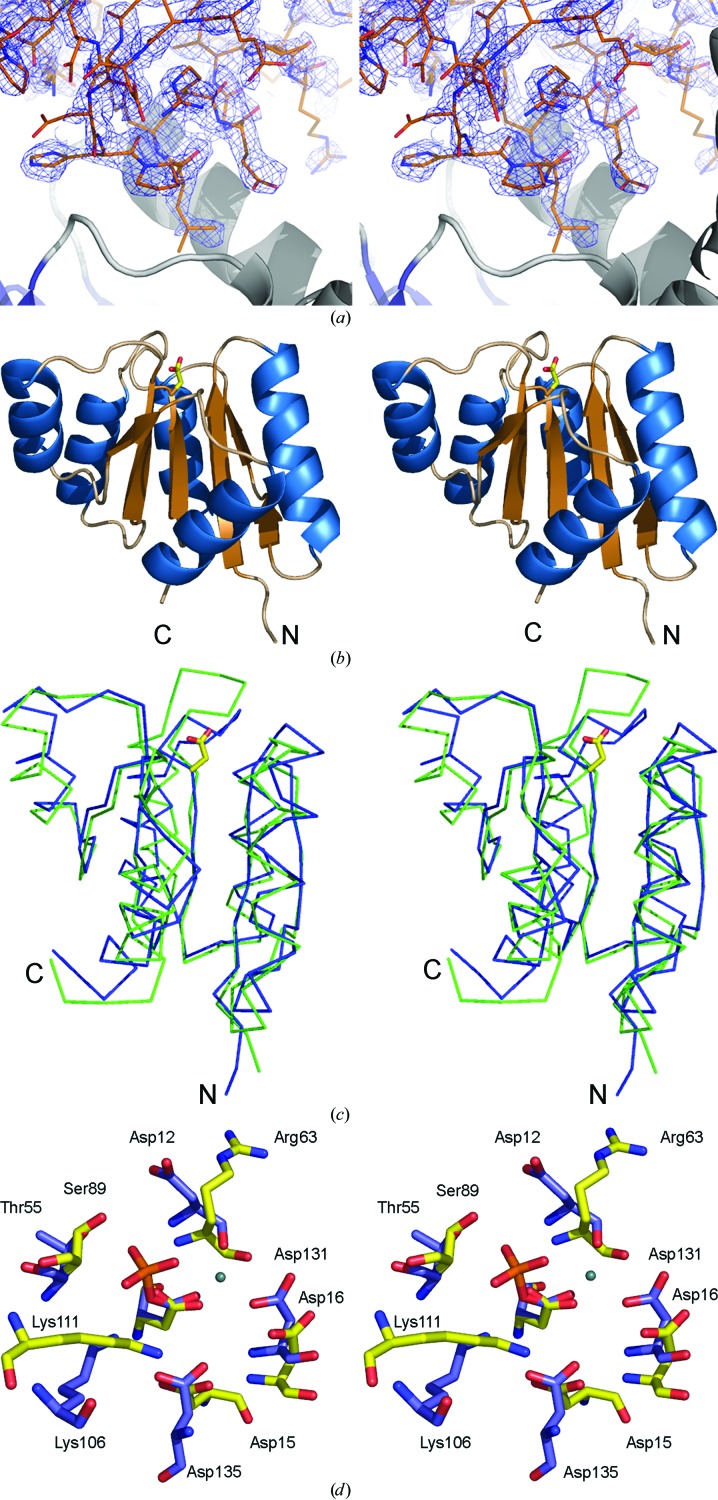
Figure 1.
(a) Part of the unbiased 2F o − F c map illustrating the difference density for the fourth molecule (monomer D) in the asymmetric unit. The electron-density map was obtained after locating molecules A, B and C by molecular replacement and refinement using only these three molecules. The refined structure of part of molecule D is included. (b) Cartoon of the overall structure of the signal receiver domain of NarL from M. tuberculosis. Helices are shown in blue and β-strands in brown. The side chain of Asp61, the site of phosphorylation, is indicated as a stick model. (c) Superposition of the Cα traces of the N-terminal signal receiver domains of NarL from M. tuberculosis (blue) and E. coli (green). The side chain of Asp61, the site of phosphorylation, is indicated as a stick model. (d) Comparison of the phosphorylation site in NarL from M. tuberculosis (standard colours) with the active site of histidinol phosphate phosphatase from E. coli (PDB code 2fpw; blue lines). The active site of the histidinol phosphate phosphatase contains a phosphorylated reaction intermediate, the phosphoryl–aspartic acid mixed anhydride formed at position Asp57, and a Ca2+ ion (indicated by a green sphere) replacing the catalytic Mg2+ ion.

