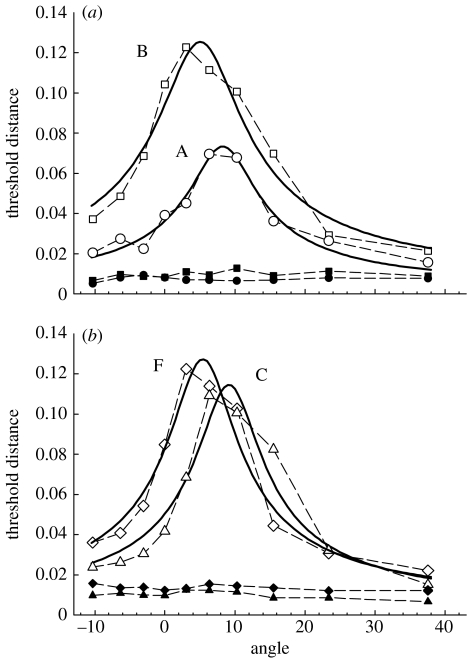
Figure 1.
Results of the tritan line location experiment, for (a) subjects A (circles) and B (squares), and (b) subjects C (triangles) and F (diamonds). Unfilled symbols give thresholds following the offset of a bright yellow adaptation background, and filled symbols give thresholds using a constant white background. Thresholds are in a scaled version of MacLeod–Boynton space (S/(L+M)×4.0), with angles giving the clockwise angular rotation of the theoretical tritan line. Solid curves give best fitting (least squares) three parameter templates described in the text.

