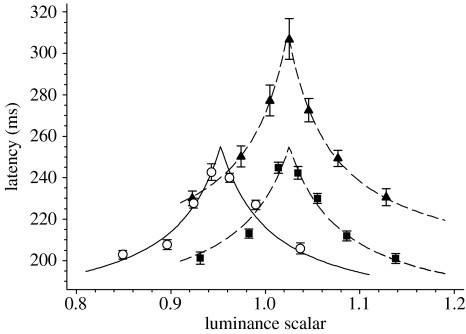
Figure 2.
Saccadic latency for coloured stimuli as a function of relative luminance, for a single observer (A). A scalar of 1.0 means that colours had the same luminance (CIE 1931 colour space) as the background. Targets were Gaussian patches (s.d.=0.3°) presented either centrally (upon which the subject looked towards 0.2° black dot continuously present at 4° peripherally) or 4° peripherally (circles, +S (peripheral); squares, +M (peripheral); and triangles, +M (central)). The lines give the best fitting (least squares) model described in the text (equation (2.2)).

