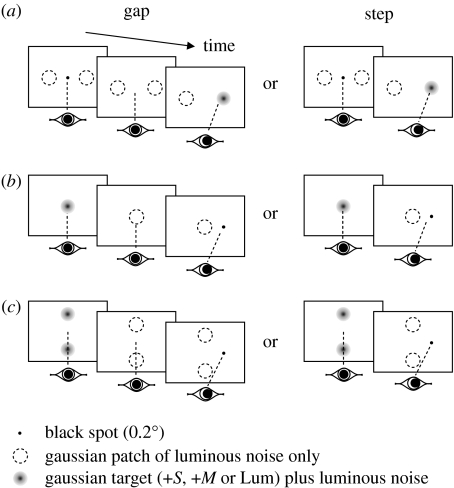
Figure 3.
Schematic of the protocols for the first three experiments ((a) experiment 1, (b) experiment 2, and (c) experiment 3). In each case, the final target is shown on the right although in 50% of trials it appeared on the left. Step and gap tasks were randomly interleaved on a trial-by-trial basis.

