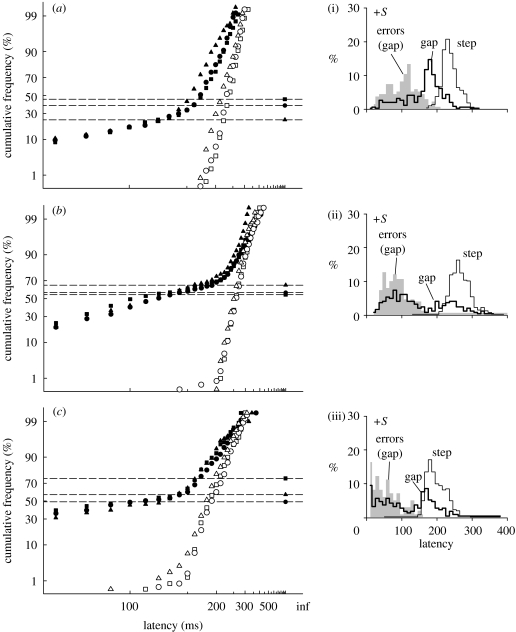
Figure 4.
Experiment 1: (a–c) reciprobit plots of saccadic latency for saccades in the correct direction, for a gap and step tasks for three observers. Targets were Gaussian patches located 4° either side of a black fixation spot. Isolated data points to the right of each panel give the number of saccades made in the opposite direction to the target (errors), expressed as a frequency (=errors/number of correct saccades): CIs for these frequencies are given in table 1. Median latencies (ms) were: (a) subject A (step: 230, 237, 214; gap: 182, 188, 166); (b) subject B (step: 259, 258, 250; gap: 150, 112, 128); and (c) subject C (step: 190, 186, 180; gap: 139, 103, 133; step task: open circles, open squares and open triangles; gap task: filled circles, filled squares and filled triangles (+S, +M, Lum), respectively). (i–iii) Latency distributions for the +S stimulus for both step (thin lines) and gap (thick lines) tasks and error distributions for the gap task (grey fill).

