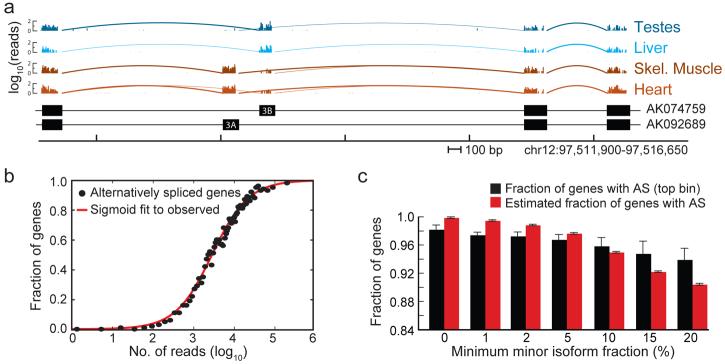
Figure 1. Frequency and relative abundance of AS isoforms in human genes.
a, mRNA-SEQ reads mapping to a portion of the SCL25A3 gene locus. The number of mapped reads starting at each nucleotide position is displayed (log10) for the tissues listed at right. Arcs represent junctions detected by SJ reads (bold arcs for junctions supported by >10 reads). Below – exon/intron structures of representative transcripts (GenBank accessions shown at right). b, Mean fraction of multi-exon genes with detected AS in bins of 500 genes, grouped by total read count per gene. A gene was considered as alternatively spliced if SJ reads joining the same 5′SS to different 3′SS, or joining the same 3′SS to different 5′SS were observed. The true extent of AS was estimated from the upper asymptote of the best-fit sigmoid curve (red). c, Frequency of AS in top bin and after estimation (as in b), considering only events with relative expression of less abundant (minor) splice variant exceeding given threshold. Bars indicate SEM.

