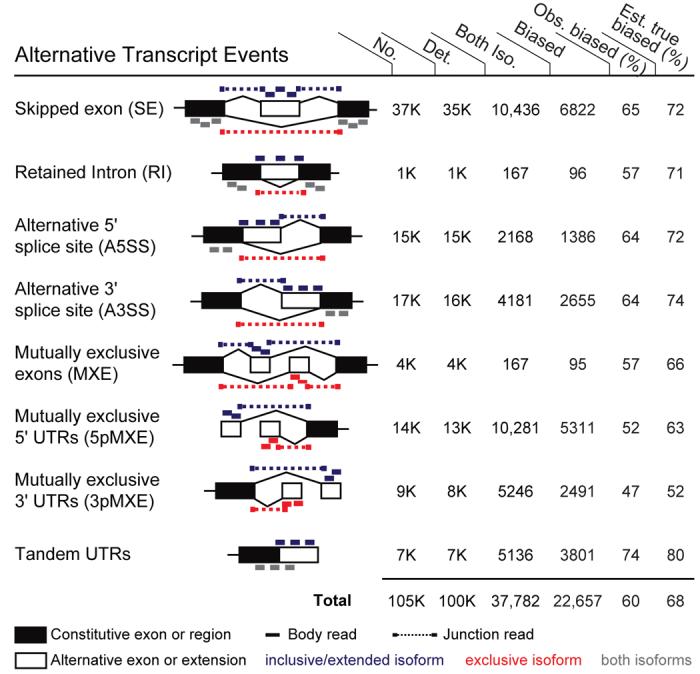
Figure 2. Pervasive tissue-specific regulation of alternative mRNA isoforms.

Rows represent the 8 different alternative transcript event types diagrammed. Mapped reads supporting expression of upper isoform, lower isoform or both isoforms are shown in blue, red, and gray, respectively. Columns 1-4 show numbers of events of each type: (1) supported by cDNA and/or EST data; (2) with ≥ 1 isoform supported by mRNA-SEQ reads; (3) with both isoforms supported by reads; and (4) events detected as tissue-regulated (Fisher's exact test) at an FDR of 5%. Columns 5-6 show: (5) the observed percentage of events with both isoforms detected that were observed to be tissue-regulated; and (6) the estimated true percentage of tissue-regulated isoforms after correction for power to detect tissue bias and for the FDR (Fig. S3). For some event types, ‘common reads’ (gray bars) were used in lieu of (for tandem 3′ UTR events) or in addition to ‘exclusion’ reads for detection of changes in isoform levels between tissues.
