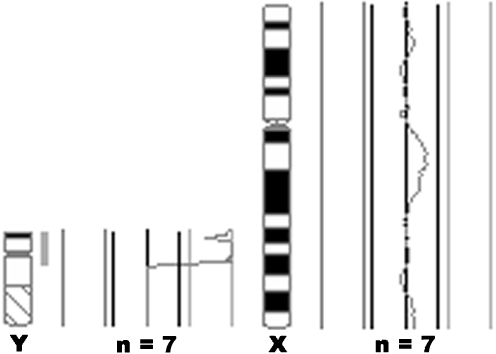
Fig. 2.
CGH analysis of patient 1’s DNA. The average fluorescence profiles obtained from the analysis of seven cells are shown for the Y and X chromosomes where a female reference DNA was used. The CGH profile for the Y chromosome shows a gain of the Y chromosome short arm, as indicated by the shift to the right. The presence of two X chromosomes in the male patient is also shown, indicated by a 1:1 fluorescence profile

