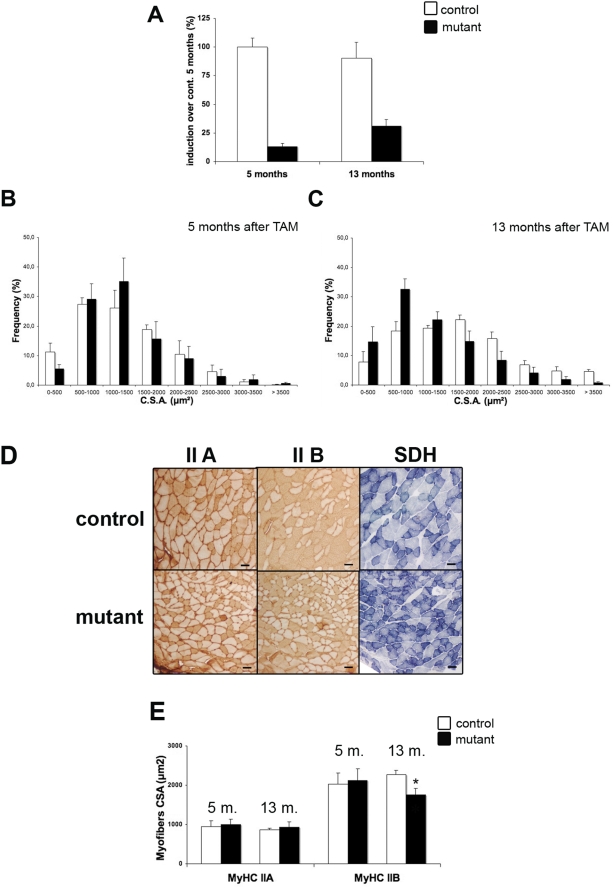
Figure 2. Progressive atrophy of MyHC-IIB fibers and metabolic switch in SRF deficient muscles.
(A) Quantitative real-time PCR was performed on RNAs prepared from gastrocnemius muscles of control (white) and mutant (black) mice 5 months (5 m.) and 13 months (13 m.) after TAM injection (n = 4). Mean expression levels for SRF mRNAs was normalized using Cyclophilin transcripts as a reference. (B, C) Frequency histogram showing distributions of muscle fiber CSA in control (white) and mutant (black) plantaris muscles 5 (B) and 13 (C) months after TAM injection (n = 4 for control and mutant at each time; 600 fibers were analysed for each muscle) (D) Immunostaining analysis using MyHC-IIA,-IIB antibody (left and middle panels) and SDH staining (right panel) of transversal sections of control and mutant plantaris muscles 13 months after TAM injection. Bars: 50 µm. (E) Mean myofiber CSA of MyHC-IIA or -IIB expressing myofibers from control (white) and mutant (black) 5 and 13 months after TAM injection (n = 4, 600 myofibers were measured for each muscle). *P<0.05 over controls 13 months after TAM injection.

