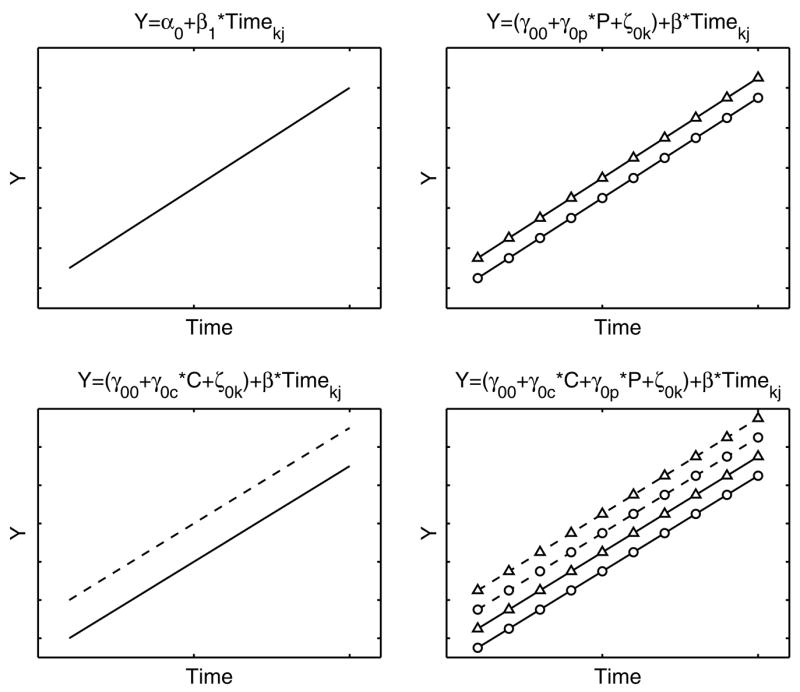
Fig. 5.

Schematic of multilevel linear model approach. The top left panel shows the level-1 model. The top right panel adds a level-2 model that includes an effect of participant P, triangles and circles correspond to two different participants. The bottom left panel adds a level-2 model that includes an effect of condition C, solid and dashed lines correspond to two different conditions. The bottom right panel combines these level-2 models so that both condition and participant effects are represented.]
