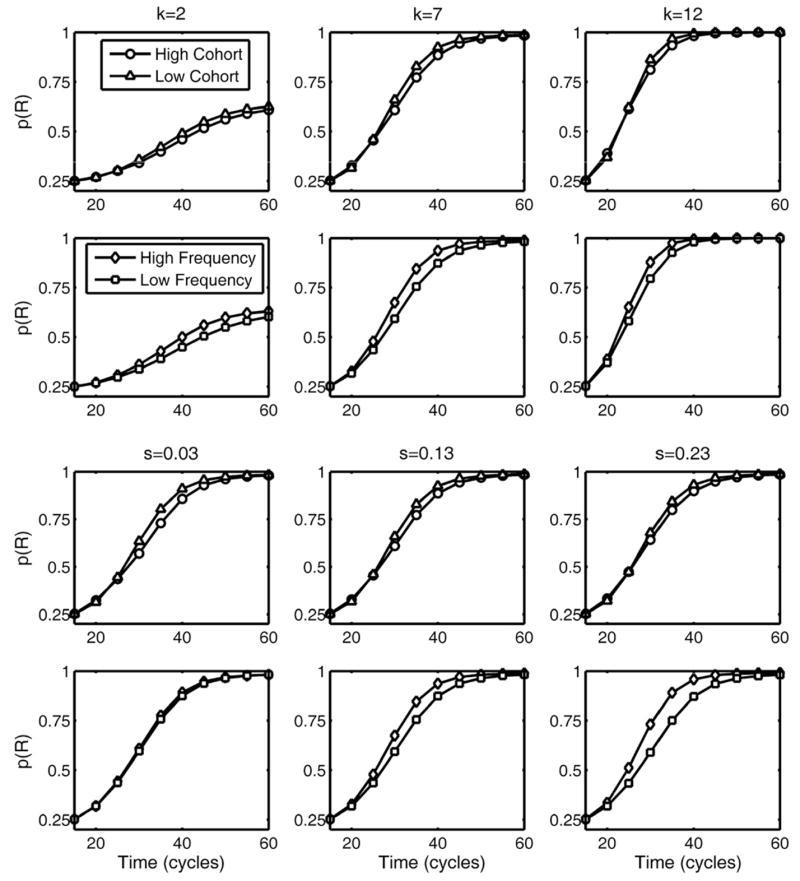
Fig. 9.

TRACE “individual difference” plots of cohort (first and third row) and frequency (second and fourth row) effects under manipulation of k (top two rows) and s (bottom two rows). Manipulation of k primarily affects curve shape and cohort and frequency effects tend to increase together. Manipulation of s has small impact on curve shape and opposite effects on frequency and cohort effects.
