
FIGURE 1.
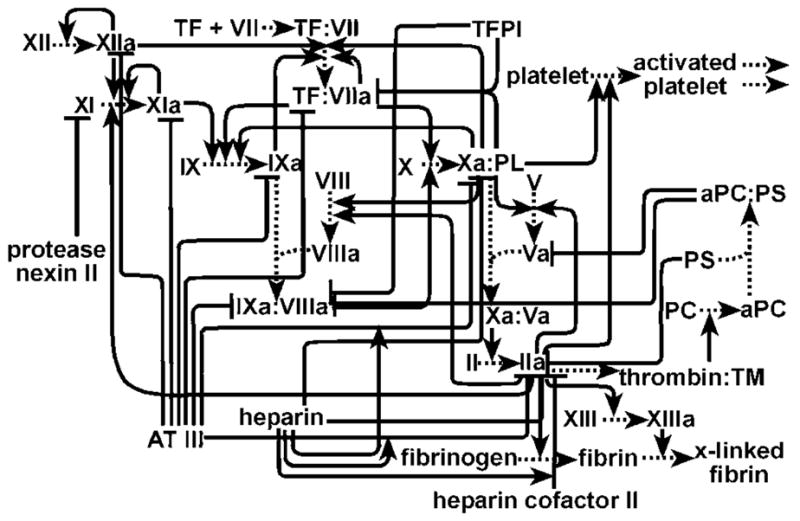
A network diagram of the complex reaction network of hemostasis. Only a portion of the molecular players and the connections between them are shown. Lines ending with an arrow indicate activating interactions, and lines ending with a bar indicate inhibitory interactions.