
Fig. 1.
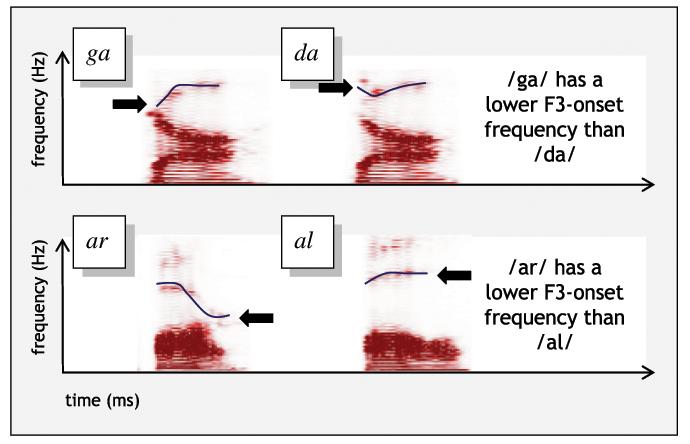
Spectrograms showing the formant patterns for the sounds ga, da, ar, and al. Formants are patterns of high-energy peaks; sound frequency is plotted against time from sound onset and continuing through offset; darker colors illustrate higher-amplitude sound. Note that patterns for ga and da are similar except that, in the higher-frequency range, one of the formants—the third formant or F3 (tracked with blue lines)—starts relatively low for ga and relatively higher for da. The patterns for ar and al are also similar but ar has a lower frequency F3 offset than al.