
Figure 2.
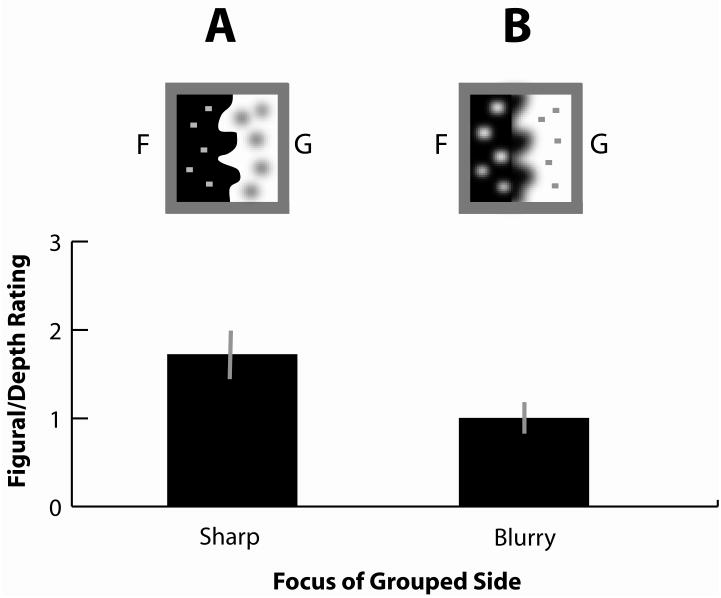
Figural/depth rating as a function of edge-texture blur similarity for two types of edge: blurry and sharp (in these conditions the grouped side is blurry and sharp, respectively). Positive ratings indicate results consistent with the ERG hypothesis. (A) An example display in which the edge is in sharp focus and grouped with the sharp texture elements on the left side of the display. (B) An example display in which the edge is blurry and grouped with the blurry texture elements on the left side of the display. Error bars represent standard errors of the mean.