
Figure 5.
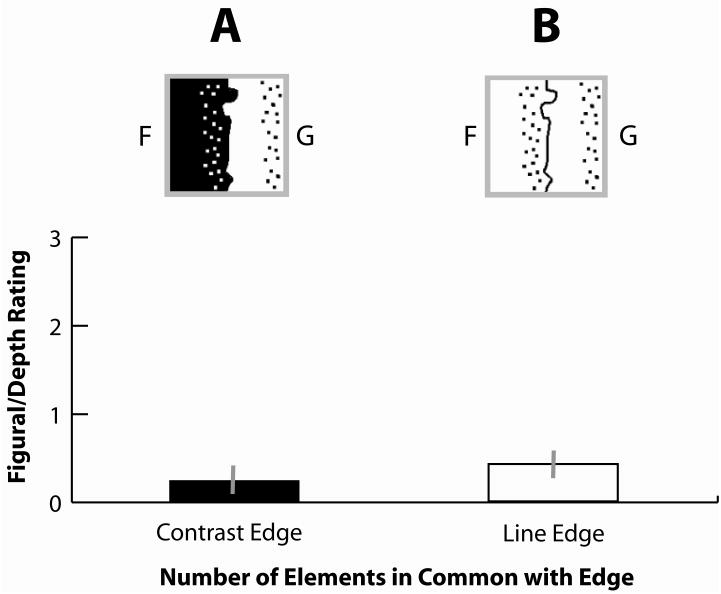
Figural/depth rating as a function of edge-texture proximity for two types of edges: contrast edges and line edges. Positive ratings indicate results consistent with the ERG hypothesis. Example displays are shown for the conditions with (A) a contrast edge (grouped left by proximity) and (B) a line edge (grouped left by proximity). The left side of each display would be predicted to be figural by the ERG hypothesis. Error bars represent standard errors of the mean.