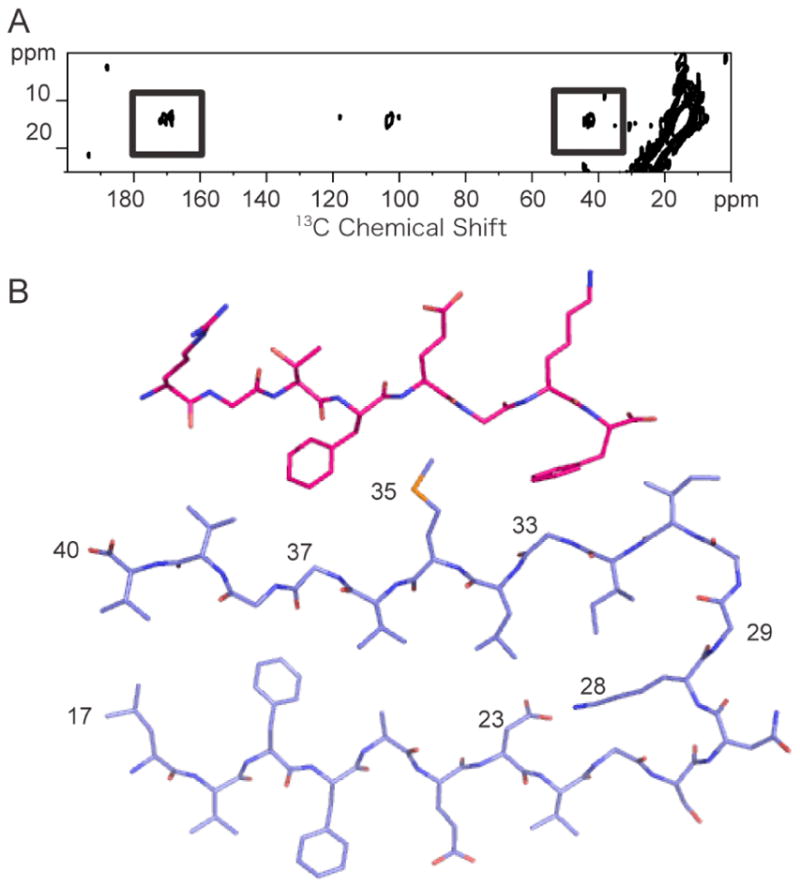
Figure 9.

Solid-state 13C NMR of the Aβ40-I1 complex. A. 2D 13C DARR NMR spectrum of the Aβ40 – I1 complex. The spectrum was obtained using Aβ40 labeled with 5-13C-Met35 which had been incubated with the I1 inhibitor labeled at Gly2 (1-13C) and Gly6 (2-13C). Cross peaks (boxed) are observed between the inhibitor (1-13C Gly2 and 2-13C Gly4 at ~170 ppm and 40 ppm, respectively) and the Aβ40 peptide (5-13C Met35 resonance at 15 ppm). B. Structure of the I1 inhibitor bound to a monomer of Aβ40. The two aromatic side chains of the inhibitor (Phe4 and Phe8) pack against Gly33 and Gly37 of the Aβ peptide.
