
Figure 1.
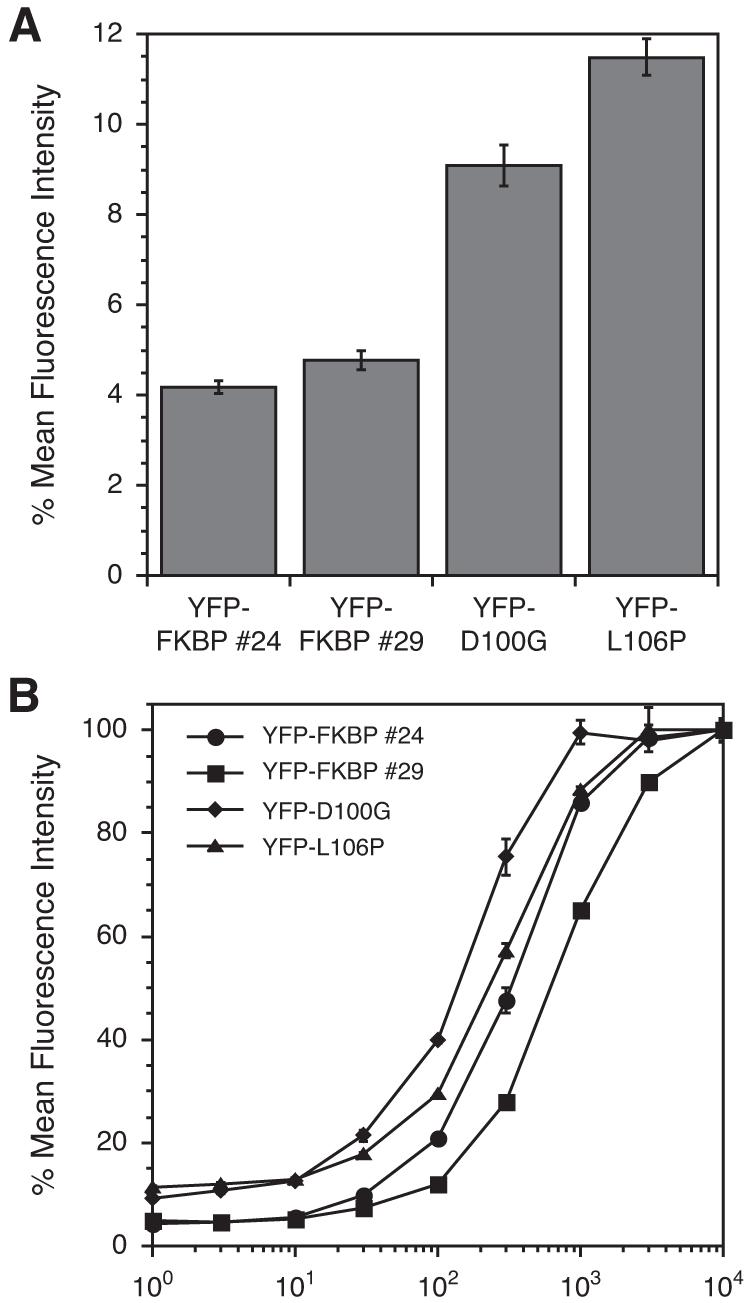
(A) Mean fluorescence intensity of C-terminal FKBP mutants in the absence of Shield-1. (B) NIH3T3 cells stably expressing YFP-FKBP fusions were treated with varying concentrations of Shield-1 (1 nM to 10 μM) for 24h and analyzed by flow cytometry. Data for panels A and B are presented as a percentage of the maximum fluorescence intensity observed for the individual mutant for an experiment performed in triplicate (± s.d).