
Figure 3.
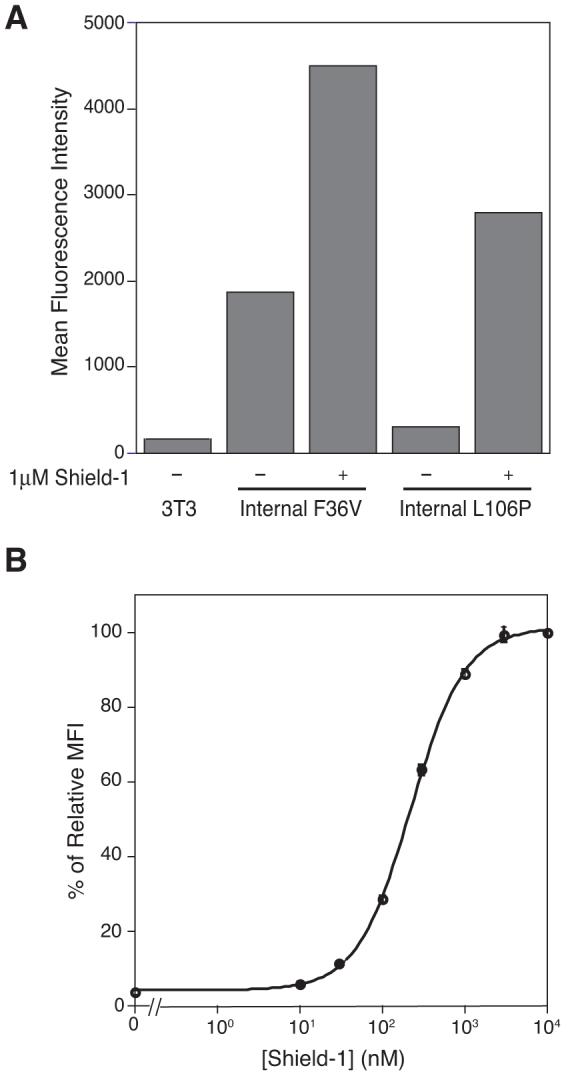
(A) NIH3T3 cells stably expressing NYFP/FKBP/CYFP fusions were mock-treated (-) or treated with 1 μM Shield-1 (+) for 24h. Fluorescence of the fusions was determined by flow cytometry. (B) NIH3T3 cells stably expressing NYFP/L106P/CYFP were either mock-treated or treated with varying concentrations of Shield-1 (10 nM to 10 μM) for 24 hours. Mean fluorescence intensity was normalized to 100% at 24h, 10 μM Shield-1. The experiment was performed in triplicate (± s.d).