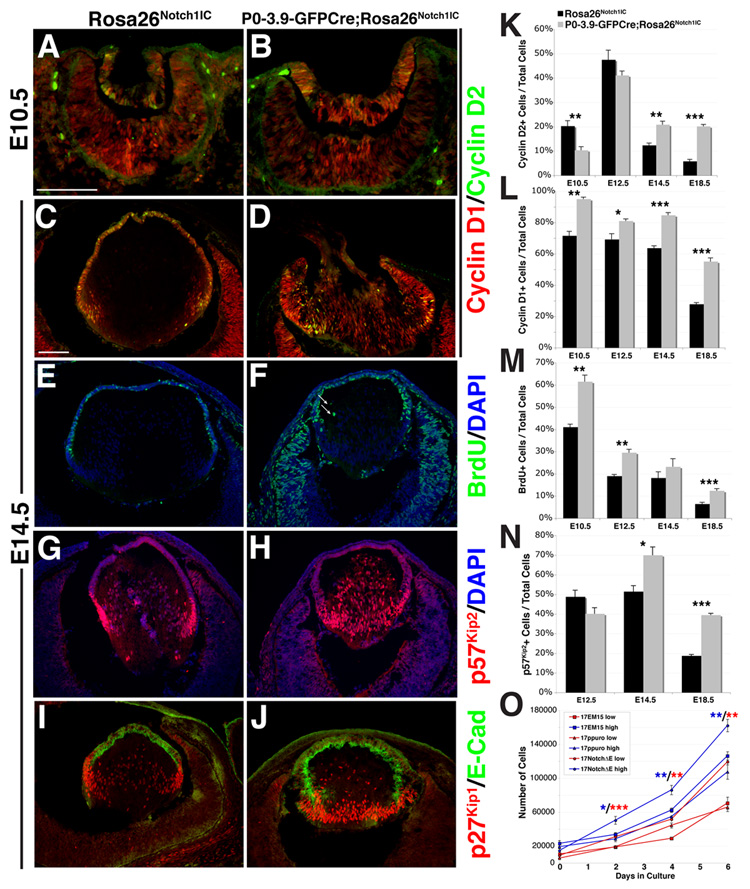
Figure 7. Lens proliferation is increased in activated Notch lenses.
(A–D) Cyclin D1 (red) is highly expressed throughout E10.5 P0-3.9-GFPCre;Rosa26Notch1IC lenses and inappropriately maintained in E14.5 P0-3.9-GFPCre;Rosa26Notch1IC posterior lenses. Cyclin D2 (green) is decreased in E10.5 P0-3.9-GFPCre;Rosa26Notch1IC lenses, but increased in E14.5 P0-3.9-GFPCre;Rosa26Notch1IC posterior cells, where it is normally absent. (E–F) BrdU+ S phase cells are increased in P0-3.9-GFPCre;Rosa26Notch1IC lenses, with rare dividing cells in E14.5 P0-3.9-GFPCre;Rosa26Notch1IC posterior lenses (arrows, approximately 0–2 cells per section). (G,H) Highest levels of p57Kip2 or (I,J) p27Kip1 expression are normally observed at the transition zone, but are expanded through the entire posterior lens in E14.5 P0-3.9-GFPCre;Rosa26Notch1IC eyes. (K–N) Quantification of proliferation markers in E10.5 – E18.5 lenses as indicated. (O) Quantification of proliferation over 6-days in culture shows increased proliferation of 17NotchΔE cells relative to controls. Cells were plated at low density (10,000 cells, red) or high density (20,000 cells, blue). Data points show mean +/− s.e.m. * = P<0.05. ** = P<0.01. *** = P<0.001. Bar in A,C = 100 microns; anterior is up in panels A–J.

